Background
・Fluoropolymers are used in automotive parts and other industrial products because of their excellent heat resistance, chemical resistance, and abrasion resistance.
Since copolymerization and end modification are used to achieve high functionality, structural analysis is important for product development and degradation analysis.
However, with Py-GC/MS only information on the constituent monomers can be obtained, and MALDI-MS is very difficult to obtain spectrum, and as isolation work is essential for 19F-NMR measurement, fluoropolymer is one of the materials that is difficult to analyze the structure.
・A case study of chain analysis of fluoroelastomers using ionRocket DART®-MS and KMD analysis is presented.
Samples
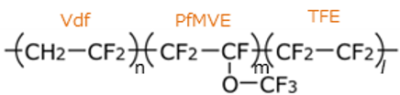
・Fluoroelastomer (Ternary copolymerization polymer)
Methods
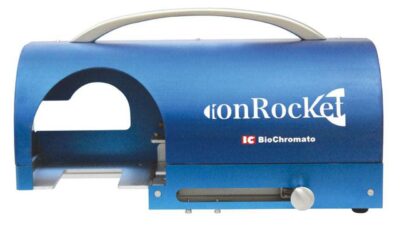
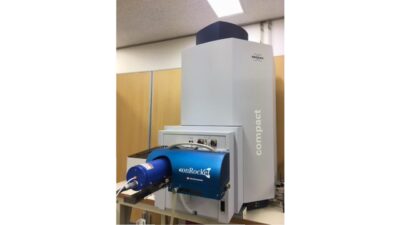
・The analysis system consisted of an ionRocket (heating device) connected between the DART🄬 ion source and the mass spectrometer (QTOFMS) (Fig. 1).
・A few mg of the sample was placed in the POT, and mass spectrometry was performed while heating from room temperature to 600°C at 100°C/min.
・KMD plots were prepared using the KMD analysis software Spectra Scope (BioChromato).
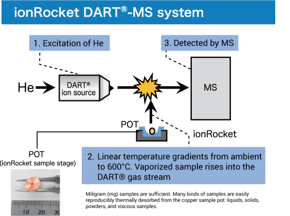
【Fig. 1: ionRocket DART🄬-MS system】
Results
The mass spectrum of fluoroelastomer in the pyrolysis region (DART® negative) is shown in Fig. 2, and it can be seen that pyrolysis components, which are presumed to be multimers of the constituent monomers of fluoroelastomer, are detected. As the composition of m/z 184.98 is presumed to be C3F7O based on the compositional analysis of exact mass, which is inferred to be PfMVE-derived. Furthermore, analysis of the high-molecular-weight side from this component shows that the PfMVE-TFE chain (m/z 284.98) and the PfMVE-PfMVE chain (m/z 350.97) are also detected.
Fig. 3 shows a KMD plot of the mass spectrum of Fig. 2, which shows that in addition to the PfMVE chain, the TFE chain (pyrolytic component with CF2 repeating structure shown in green-orange) is also detected.
Since ion-Rocket DART®-MS can detect the pyrolysis products of fluoroelastomers from low to high molecular weight, it is expected to be applied to the chain analysis of fluoroelastomers. In addition, by using KMD analysis, the detected pyrolysis components can be understood relatively easily.
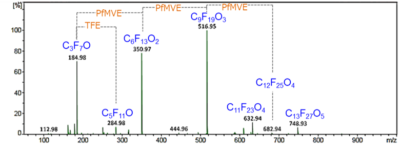
【Fig. 2: Mass spectrum of the pyrolysis region of fluoroelastomer (DART🄬 negative)】
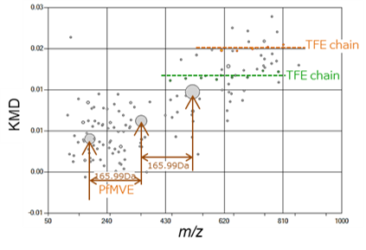
【Fig. 3: KMD plot of the mass spectrum of the pyrolysis region of fluoroelastomer (KMD: Base Unit CF2)】