Background
Natural rubber (isoprene polymers and minor impurities), is prone to rapid degradation. To protect natural rubber from chemical and physical attacks, many chemicals are added during coagulation, processing, and molding. The combination and amount of chemicals play an important role in life time of rubber products. Consequently, methods used to estimate the degree of degradation such as FT-IR and now DART®-MS are critical for both development and QC operations in rubber manufacturing.
DART®-MS (Direct Analysis in Real Time – Mass Spectroscopy) allows direct ionization of solid and liquid samples at atmospheric pressure, obviating almost all sample preparation steps. IonRocket improves DART® for polymers by subjecting the sample to a rapid temperature gradient. By using ionRocket, both small molecules and high molecular weight, difficult to volatilize compounds can be detected in the same run.
In this report, ionRocket DART®-MS is applied to a degraded rubber band and the results compared with FT-IR
Sample
Rubber band (commercial item)
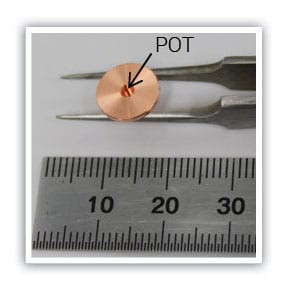
Method
The rubber band was heat treated at 130ºC for 30 min. Sample preparation: the rubber band was sliced into 0.5 mm x 0.5 mm sections, and then placed in the ionRocket copper sample pot. A temperature gradient of 100ºC/min. from room temperature to 600ºC was applied during a total run time of 7 min.
Result
The result of FT-IR by ATR (Attenuated Total Reflection) method is shown in Figure 1. In general, C=C bonds of main chains of natural rubber are decreased and >C=O is increased by heat degradation. However, FT-IR did not show any distinct differences.
IonRocket DART®-MS analysis results are shown in Figures 2 and 3, which show distinct differences due to the heat treatment. The intensity of m/z 136 at 5 min (about 400ºC) was decreased after treatment. This peak was probably from additives. In addition, the intensity of m/z 373 was increased after treatment. This peak was probably from rubber degradants.
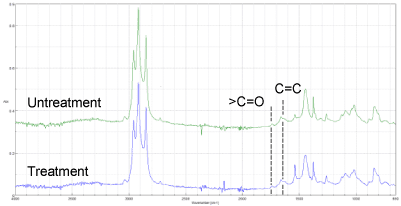
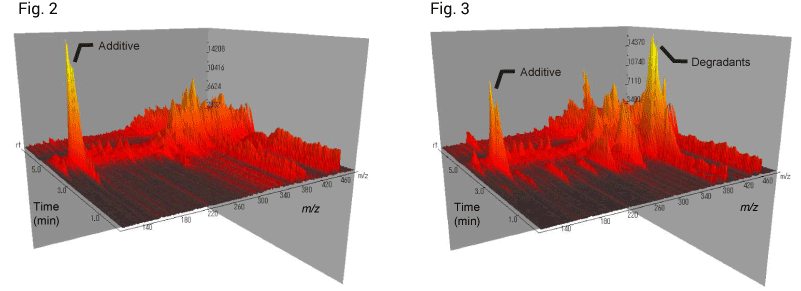
Figure 2. Before treatment | Figure 3. After treatment
Target
Material Analysis / Quality Control / Synthesized Chemistry