Background
Since paints often require material protection and stain resistance, it is often necessary to add organic and inorganic compounds such as resin, pigment, and various other additives. However, qualitative analysis to determine the material composition of these paint formulations requires much time and effort due to laborious pretreatments and sample preparation such as separation and extraction.
In this application, the material composition of paint samples were directly analyzed after drying using ionRocket combined with DART®-MS.
Sample
Water-based paints (Brand A, Brand B)
Method
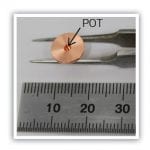
Paint samples were allowed to cure overnight at room temperature (0.5 mm x 0.5 mm) and were then placed into the ionRocket sample pot. A temperature gradient was applied by heating each sample from room temperature to 600 ℃ at a rate of 100 ℃/min (total run time: 7 min.).
Results
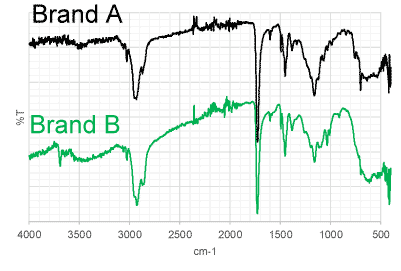
As a results of FT-IR, no significant difference was detected between these acrylic resins (Figure 1).
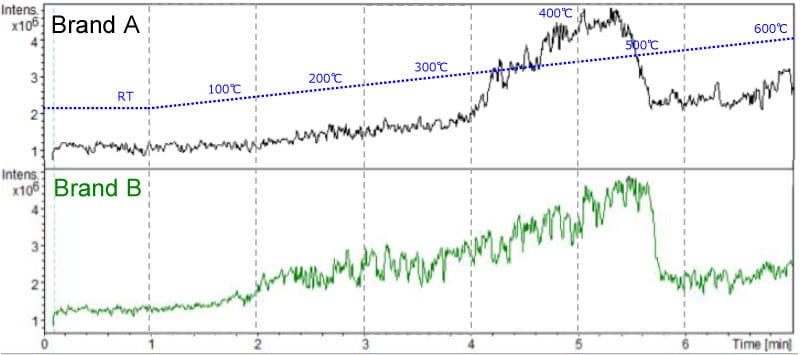
In contrast, samples were analyzed using the ionRocket combined with DART®-MS. Using this method, the total ion current gram (TIC) of these samples are shown in Figure 2. By applying the heat gradient, thermal desorption and pyrolysis reactions were detected. There was a clear distinction between the temperatures at which thermal desorption products were detected.
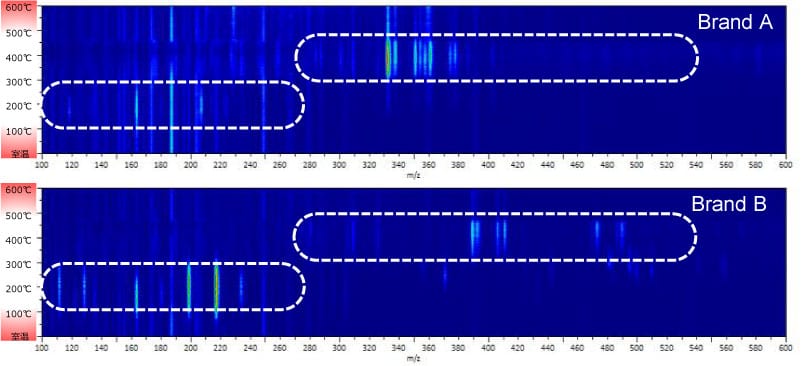
For a detailed comparison, heat maps of these samples were recorded as shown in Figure 3. It was clear that the types and the intensity of detected ions differed considerably in the low temperature and low molecular weight region.
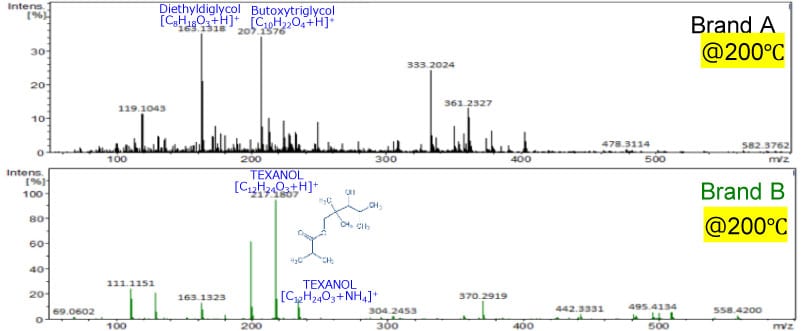
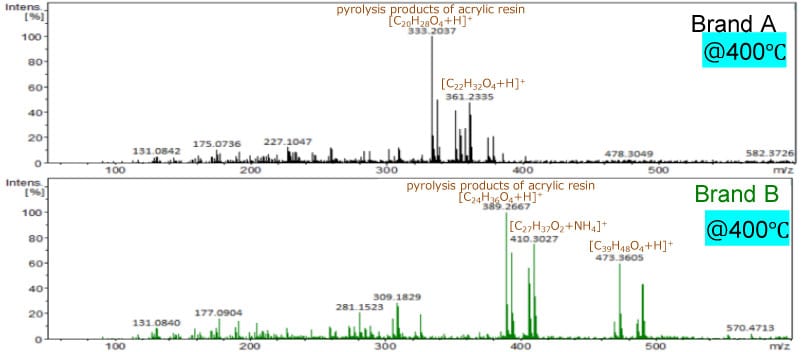
Mass spectra at 200℃ (thermal desorption region) were shown in Figure 4. The additives are different between them. In addition, mass spectra of at 400℃ (Pyrolysis region) were shown in Figure 5. Pyrolysis products of acrylic resins were detected at this temperature.
It was confirmed that ionRocket combined with DART®-MS enables the detection of additives and base-resins contained in paints without any pretreatment or sample preparation. Therefore, this analytical method is useful for R&D and QC for paints.
Target
Paints / Material Composition