Purpose
A comparison analysis of the aromatic components in three commercially available lemon sours(lemon cocktail with Japanese shochu, a distilled spirit) was conducted using a time-of-flight mass spectrometer as the detector.
Methods
| Ion Source | ChemZo (BioChromato) |
| Mass Spectrometer | compact QTOF (Bruker) |
| Measurement Method | Immediately after opening, lemon sours (A, B, C) at room temperature were transferred to a beaker, and the aromatic components were introduced to the mass spectrometer via a tube. Additionally, the aromatic components were introduced to the mass spectrometer after decarbonation. |
| Data Processing | Aromatic components were extracted from the mass spectrum using Spectra Scope and Data Analysis software. |
Results
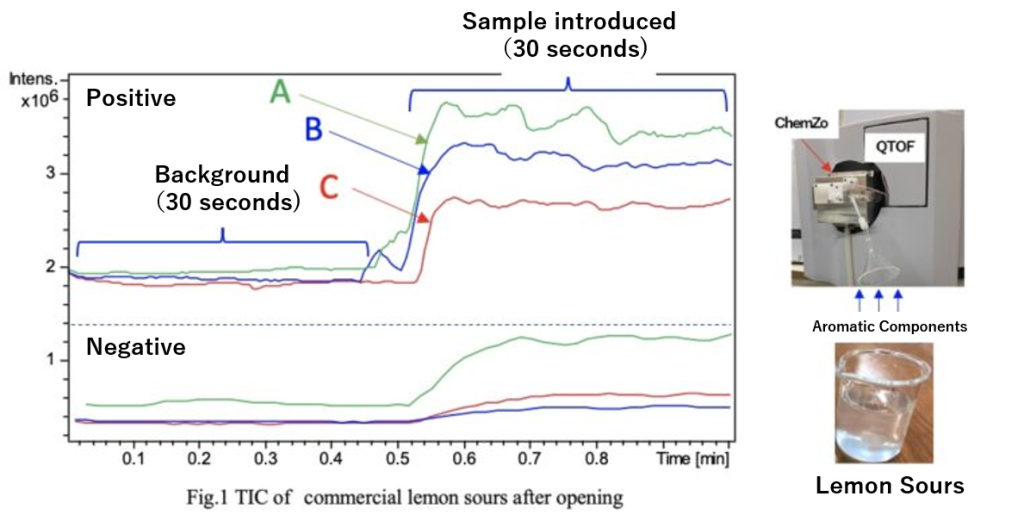
Figure 1 shows the TIC (Top: Positive mode, Bottom: Negative mode) of the lemon sours immediately after opening. Among the three types, sample A exhibited the highest intensity in both positive and negative modes. Given that the alcohol concentration is the same across the samples, the degree of carbonation and the concentration of aromatic components are likely influencing factors.
Figure 2 shows the positive mass spectrum (sampled at 30 seconds). While the sensory evaluations of the three types varied, the ion species in the mass spectra were similar. Sample A, which exhibited stronger TIC intensity, showed a tendency for higher intensities of individual ions compared to the others. This is likely due to differences in the concentration of aromatic components such as those found in fruit juice. Aromatic components such as limonene and linalool were estimated to be present.
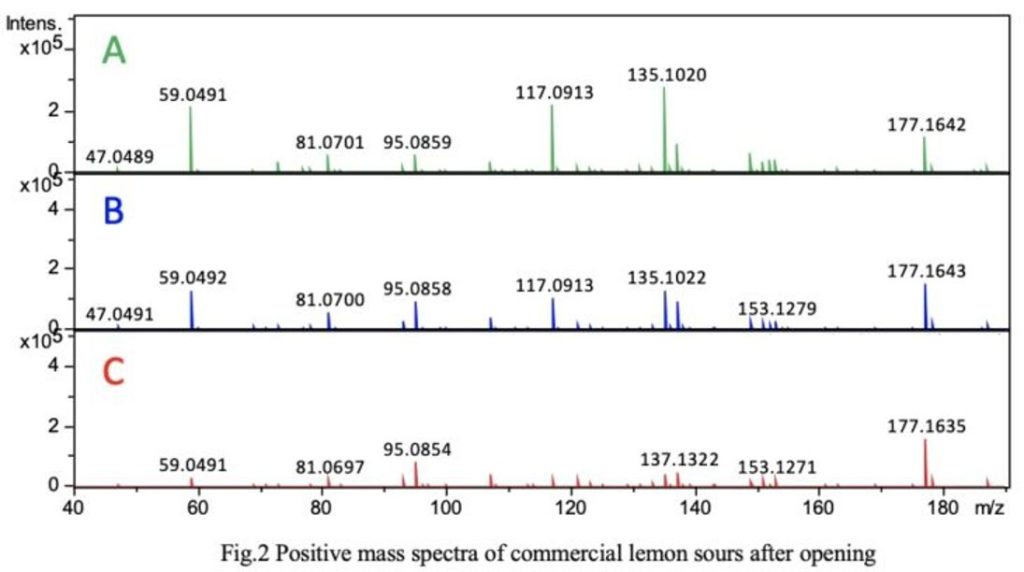
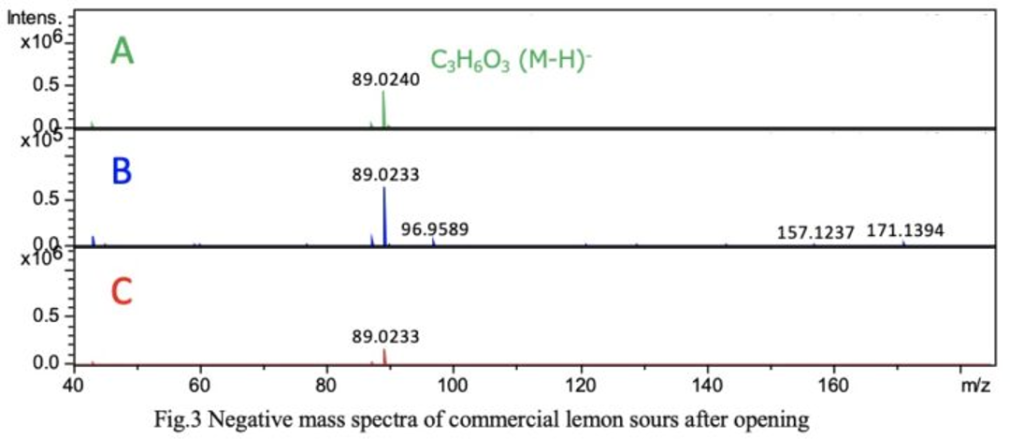
Figure 3 shows the negative mass spectrum (sampled at 30 seconds). Similar to the TIC intensity, the ion intensities varied among the three types; however, the mass spectra were highly similar and exhibited a simple profile. The chemical formula of m/z 89.0240 was estimated to be C₃H₆O₃.
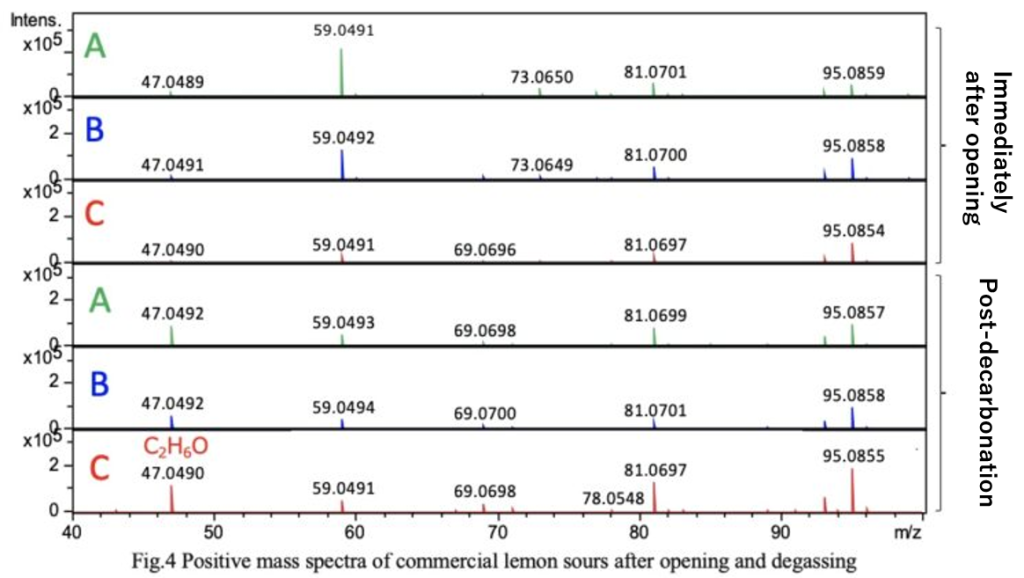
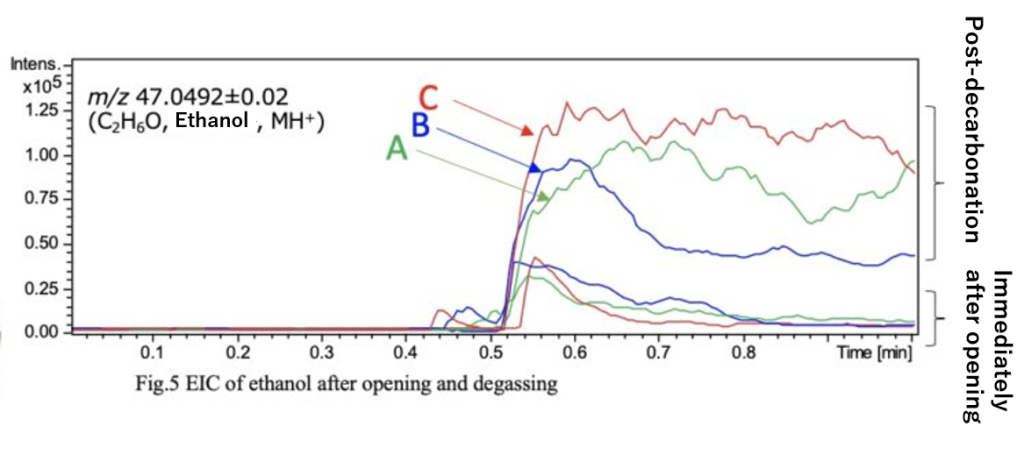
Carbonation in carbonated alcoholic beverages is an important factor contributing to appetite stimulation and refreshment. Figure 4 shows the mass spectra of the lemon sours immediately after opening and after decarbonation. Additionally, Figure 5 presents the EIC of ethanol (m/z 47.0492). From Figures 4 and 5, it was observed that reducing carbonation increases the ion intensity of ethanol.
When comparing the EIC peak areas, the ethanol ion intensity increased by approximately 2 times for sample A, 4 times for sample B, and 15 times for sample C. While decarbonation does not alter the ethanol concentration, it suggests that the amount of carbonation may influence the perception of the beverage during consumption.