Analysis of Low-Density and High-Density Polyethylene
Purpose
The analysis of thermal desorption components from low-density polyethylene (LDPE) and high-density polyethylene (HDPE) was performed using a time-of-flight mass spectrometer equipped with the ChemZo ion source and a temperature gradient device.
Methods
| Ion Source | ChemZo (BioChromato) |
| Mass Spectrometer | compact QTOF (Bruker) |
| Measurement Method | LDPE and HDPE (0.8 mg each) were individually placed into sample holders (POTs), and thermal desorption components were measured while heating from room temperature to 400°C. |
| Data Processing | TIC and mass spectra were examined using Spectra Scope and Data Analysis software. |
Results
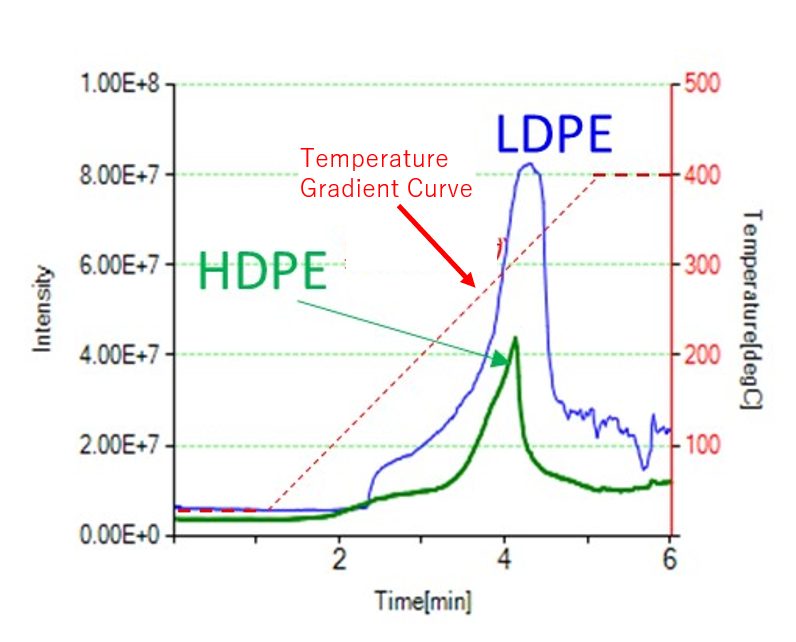
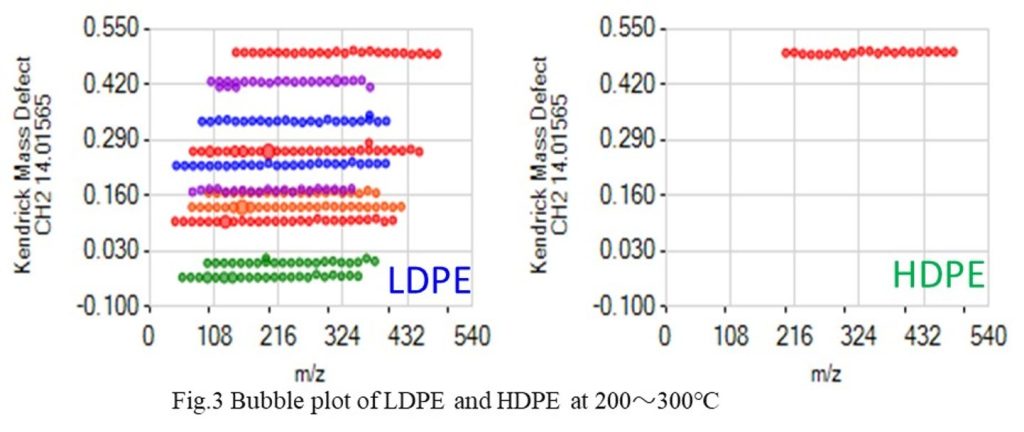
Fig. 1 shows the TICs of LDPE and HDPE. LDPE, which has a lower melting point, exhibited higher intensity. Fig. 2 presents the mass spectra during the temperature increase from 200 to 300°C. Even with the same thermal history, it was confirmed that LDPE generates more thermal desorption components than HDPE. Fig. 3 shows the bubble plot generated using the Polymer Engine. Polymer Engine is an analysis software that extracts the repeating structures of polymers from mass spectra. Here, the repeating ion for CH2 (14.0156), which was thermally desorbed, is displayed.

Each bubble corresponds to one ion in the mass spectrum, and the ion groups represent continuous ions from the repeating structure, with over 20 ions observed. LDPE detected a continuous ion group of 10 ions, while HDPE detected only one. From this, it was confirmed that when the repeating structures are similar, the material with lower thermal resistance generates more thermal desorption components at lower temperatures. (Fig.2)


