Analysis of Thermoplastic Elastomers
Purpose
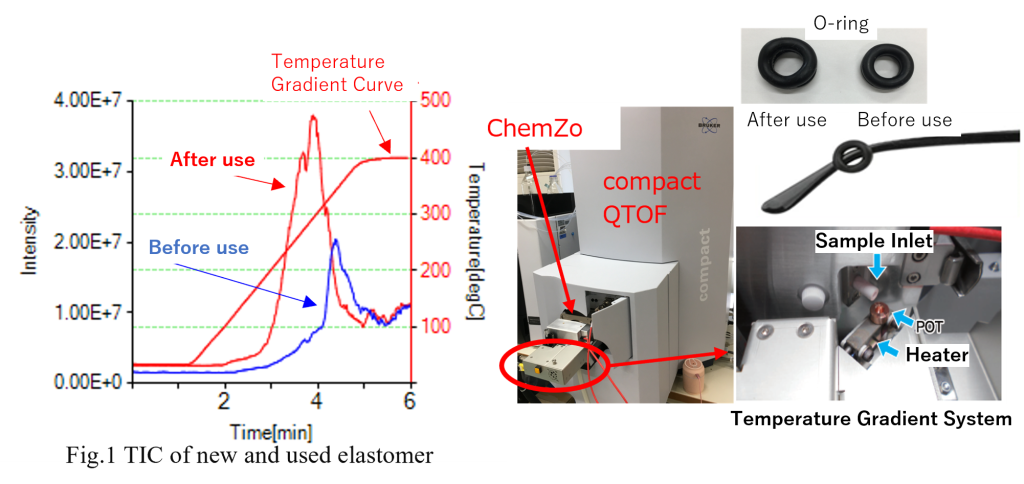
The analysis was conducted using a time-of-flight mass spectrometer equipped with the ChemZo ion source and a temperature gradient device to examine the temporal changes in thermoplastic elastomers (O-rings) before and after use.
Methods
| Ion Source | ChemZo (BioChromato) |
| Mass Spectrometer | compact QTOF (Bruker) |
| Measurement Methods | Thermal desorption components were measured by placing individual anti-slip O-rings for glasses (each weighing 0.8 mg) into separate sample POTs. Measurements were conducted for O-rings both before use and after approximately four months of use, with the temperature gradually increased from room temperature to 400°C. |
| Data Processing | The TICs and mass spectra were examined using Spectra Scope and Data Analysis software. |
Results
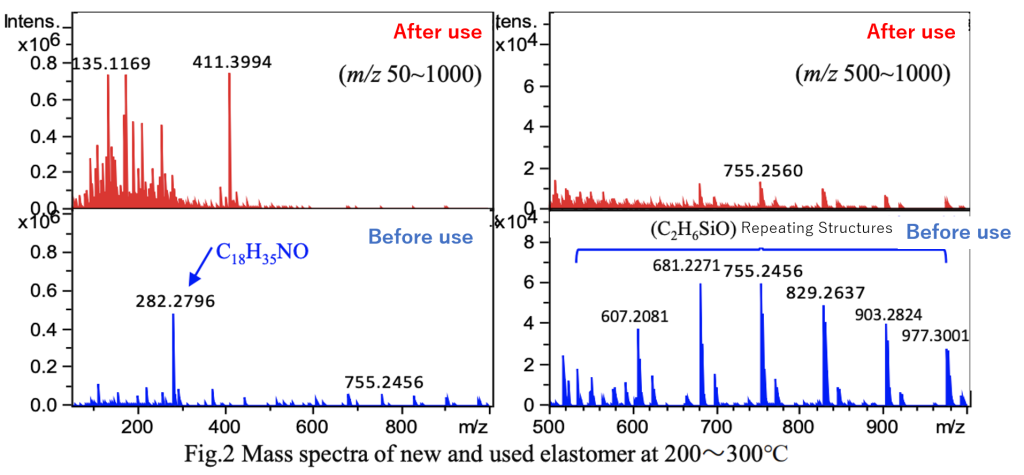
Fig. 1 shows the TICs of the thermoplastic elastomer samples before use and after use. Compared to the sample before use, more thermal desorption components were detected at lower temperatures in the sample after use. Fig. 2 presents the mass spectra during the 200–300°C temperature increase. Continuous ions, likely derived from the polymer, were detected in the thermoplastic elastomer before use, but were hardly detected after use.
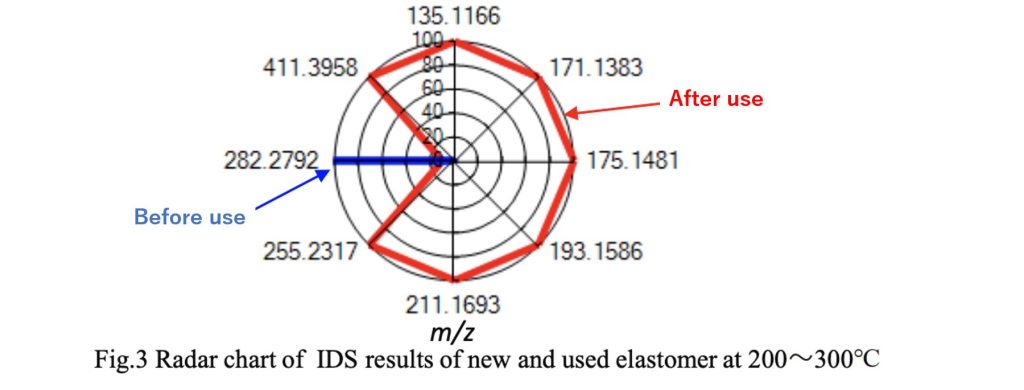
Fig. 3 displays the results of the differential analysis (IDS) before and after use in a radar chart. A large number of low molecular weight thermal desorption components were detected from the elastomer after use, likely due to the degradation of the resin in the rigid portion of the elastomer after long-term use.
Additionally, an IDS-based database search for additives suggested the presence of oleamide (C18H35NO), a lubricant.
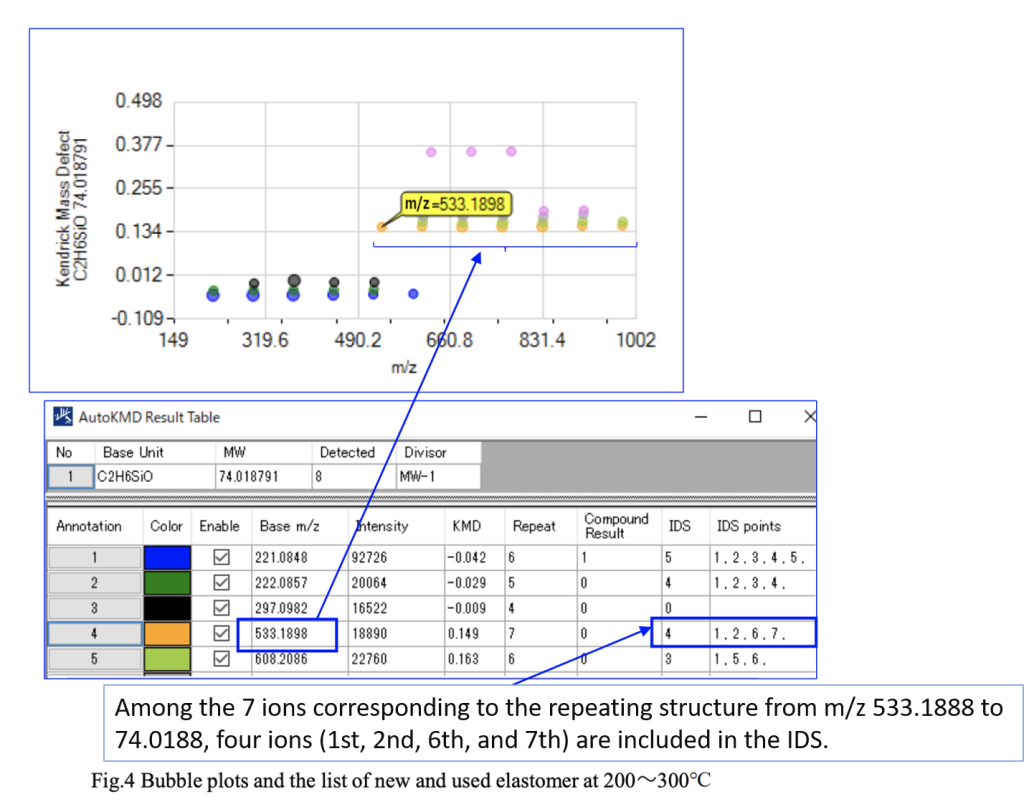
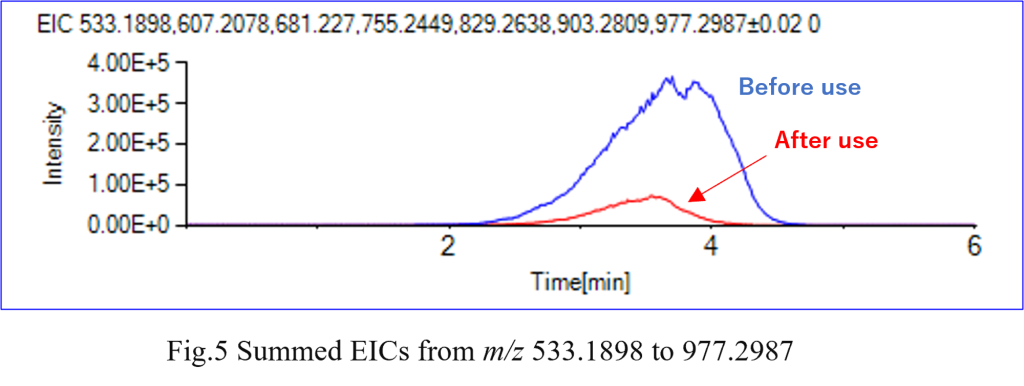
To compare the resin samples before and after use, the TIC region from 200 to 300°C was examined using Polymer Engine. Fig. 4 shows the bubble plot and summary table generated by Polymer Engine. Polymer Engine is an analysis software designed to extract repeating structures of polymers from mass spectra. In this case, the repeated ions of thermally desorbed C₂H₆SiO (m/z 74.0188) are displayed. The graph features the m/z values on the X-axis and the Kendrick Mass Defect (KMD) on the Y-axis. For instance, m/z 533.1898 in Fig. 3 indicates that seven repeating units were identified starting from m/z 533.1898. In the summary table, “IDS” and “IDS Points” denote the m/z values extracted by Polymer Engine that matched with the IDS results. The table also indicates the number of such matches and the sequence position where each value was found.
Furthermore, by combining the m/z values into an EIC (Fig. 5), it becomes possible to compare molecular species with identical repeating structures across different resins. This enables an easy comparison of differences, including degradation levels.
